IN THIS ISSUE
Types of Color Blindness: How They Affect Teaching and Learning
Improving Career Opportunities Despite a Learning Differnce
|
MILESTONES AND BREAKTHROUGHS: UNDERSTANDING LEARNING DIFFERENCES RESEARCH TO IMPROVE TEACHING METHODS
Educators of learning different students may improve teaching methods by understanding the neuroscientific bases of the differences, which need not be a daunting task. From the first pioneer in learning difference neuroscientific research, Dr. Samuel Torrey Orton, to the most recent, including Dr. Sally Shaywitz, et al, scientists and educators have delineated the etiological causes of and effective methods for the remediation of these deficits. This article describes the research of a few scientists, some of whose findings have application in teaching students with learning differences. To begin with, neuroscience historians generally credit the French neurologist Dr. Paul Broca with the inception of the modern study of language impairments. His studies influenced popular opinion in the belief that there was a language center in the brain. In 1863, he published a paper describing eight cases in which damage to the frontal lobe in the left hemisphere of the brain disturbed language expression, determined from post-mortem studies. This region of the brain, now called Broca's area, begins the analysis of phonemes, e.g., the /k/ sound of the letter C in cat, and affects speech production. In 1874, the German neurologist Dr. Karl Wernecke reported that lesions in the left hemisphere near the auditory cortex disrupt normal speech. This region, now called Wernecke's area, facilitates language comprehension. While Broca and Wernecke did not initiate research in dyslexia, their studies proved beneficial to those who did that research. Dr. Norman Geschwind, a neurologist at Harvard Medical School, later pioneered in the development of the Wernecke-Geschwind Connectionist Model, which increased the comprehension of the path of language in the brain.
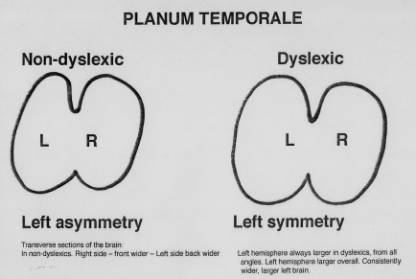
Auditory input is received in the primary auditory cortex, but an individual may not understand the word until processing of the signal occurs in Wernecke's area. If an individual wishes to speak the word, a representation transmits from Wernecke's area to Broca's area, which evokes a program for articulation, supplied to the motor cortex, that then drives the muscles to produce speech. For most individuals, these functional regions are found only in the left hemisphere. In 1896, Dr. James Hinshelwood, an ophthalmologist in Scotland, introduced the term congenital word blindness to describe patients with reading disorders. He believed the problems they had with visual memory related to reading derived from brain injury or defects in the left language portion of the brain. Dr. Samuel Torrey Orton, however, receives the credit for initiating neurological dyslexia research. A psychiatrist and neuroscientist, he introduced the term strephosymbolia from the Greek, meaning twisted symbols, to describe reading reversals. While he predicted the precise location in the brain for the site of the difference in brain architecture, he did not receive all of the funding necessary to pursue that aspect of dyslexia research. His associate, Anna Gillingham, a psychologist, developed the prototype for multisensory instruction of dyslexic individuals. Geschwind, along with Dr. Albert Galaburda and several other doctors, discovered differences in the brain architecture of dyslexic individuals as compared to those of the non-dyslexic individuals. In 1979, Drs. Galaburda and T.I. Kemper published their findings, reporting the first biological evidence of the differences from post-mortem studies.
Please note that in a transverse section of the brain in the planum temporale, a part of the temporal lobe which is at the side of the brain, the non-dyslexic brain is asymmetrical, whereas the dyslexic brain seems symmetrical. Since these differences appear in one of the language processing portions of the brain, this may indicate that these differences in brain architecture might result in differences in processing either receptive (reading/listening) or expressive (writing/speaking) language.
Within the mid-brain region, the left and right sides of the thalamus each contains two nuclei. The layers of the nuclei lie in a bent shape, which explains their designation as geniculate, from the Latin geniculatus which means bent like a knee. The lateral geniculate nuclei (LGN), near the sides of the brain, process visual input, and the medial geniculate nuclei (MGN), near the middle of the brain, process auditory input.
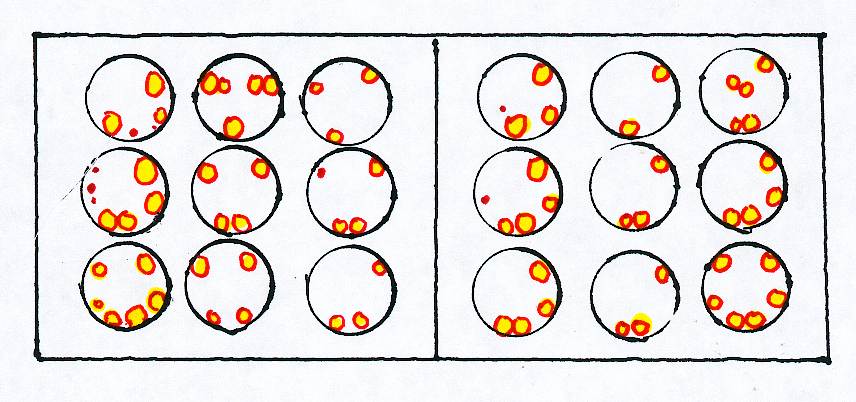
The scientists found that the magno cells in dyslexic individuals were smaller than those in non-dyslexic individuals, and that the dyslexic individuals processed low contrast information more slowly than non-dyslexic individuals. Next, Dr. Alexander Pollatsek reported important findings. Eye movements, called saccades, allow non-dyslexic readers to fixate on an image so that the brain perceives it before advancing to the next image. The image during the saccade is suppressed so as not to overlap the next image. The sustained or parvocellular system operates during fixation and the transient or magnocellular system operates during saccades or movements to the next fixation. Dyslexic individuals have a deficit in saccadic suppression. Geneticists also have provided relevant and significant data, and have documented the heritability of dyslexia with DNA testing. Dr. Jeffrey Gilger states that suspect genes are thought to lie on chromosomes 2, 3, 6, 7, l5, 18, and perhaps others. This heritability has implications for diagnosis and counseling of family members, since not every member is affected, and those who are affected may not exhibit identical manifestations of dyslexia. Most recently, Dr. Sally Shaywitz, et al, at Yale University Medical School, reported the results of a longitudinal study. The researchers tested the cohort in reading performance in elementary and secondary schools yearly. The researchers then categorized the readers as non-impaired (NI) who scored well in both schools, as accuracy improved readers (AIR) who scored poorly in elementary school but improved in secondary school, and as persistently poor readers (PPR) who scored poorly consistently. The neuroscientists assigned the readers two primary tasks: reading real words to match them by category (CAT), and reading pseudowords to see if they rhyme (NWR), then scanned the brains during these tasks. The first row of abbreviations indicates the tasks administered, NWR or CAT, and the next row identifies the type of student, NI, AIR or PPR. The columns contain superimpositions of the scans of all participants within each group, in transverse sections nearest the top, middle or bottom of the brain. The data within the scans include red and yellow patches, which designate greater activation.
Some terms useful in reading the original text including the brains scans (please see the bibliography) follow. The variable n indicates the number of participants in each group of readers. A pixel is equal to the dot in a photograph, e.g., in a newspaper photograph, and a voxel is a three dimensional pixel. The term seed as applied in reading a brain scan refers to the starting point from which measurement of other data is possible. Functional connectivity is a term that represents which areas are correlated with similar activity. The neuroscientists discovered that the PPR participants processed information differently from the other participants. The researchers analyzed the functional connectivity in the real word reading category (CAT) most since they found that the PPR participants demonstrated unexpected brain activation during that task. According to Shaywitz, the researchers hypothesize that in NI readers the occipitotemporal region processes print in a linguistically structured manner, and should interact with other areas involved in orthographic and phonological processing. It is also hypothesized that in the PPR participants the occipitotemporal area serves as a visually based memory system and should interact with other areas involved in memory retrieval. The ensuing scans within that article contrast the results within each group with one another. In addition, the researchers tested the I.Q. of the participants in the study, and found that the NI and AIR participants scored higher in elementary and secondary schools than the PPR participants. The researchers concluded that the AIR and PPR groups began school with similar abilities, but not necessarily the same deficit. The AIR group had better cognitive abilities and advanced in reading ability because of that cognition. Is it possible that the PPR participants, from lower socioeconomic strata and attending more subsidized lunch schools with generally fewer amenities had less opportunity for auditory stimuli such as music instruction, and thus had more unremediated auditory processing deficits which prevented them from using the occipitotemporal area except as a primarily visual system? Additionally, is it further possible that, if they had unremediated auditory processing deficits, they scored lower on I.Q. tests overall because of the portions administered verbally? Furthermore, since the parents of the PPR participants more often came from a lower socioeconomic strata than the parents of the NI and AIR participants, is it possible that more parents of the PPR participants read poorly or not at all, or held two or more jobs? This lessens the chances of their reading to their children or of interacting with them in other ways that develop language skills such as communication at mealtimes or trips to the library or museum. Most important, since the PPR participants attended schools where a higher percent received school-subsidized meals than either the NI or AIR participants, the PPR participants may have resided in areas with a higher degree of poverty and thus less of a tax base to fund academic services than the other readers. This, in turn, may indicate that the schools the PPR participants attended not only had fewer amenities such as music, art, and library services, the school personnel likely faced severely diminished operating budgets. As a result, the PPR participants may have had less textbooks, generally outdated and in disrepair, or not any, less heat or none in winter, fewer and less experienced teachers, far larger class sizes in schools in need of repair, some rooms sealed off, and more discipline problems and violence, any or all of which may contribute to low scores in standardized testing. Lastly, while some note it is difficult at times to distinguish want of effort from impairment, others observe a fear of failure along with a learning difference produces want of effort. However, the appropriate intervention may facilitate comprehension and subsequently improve perseverance and performance. The authors stress the need for an increase in phonics and vocabulary instruction in order to decode and comprehend that which students read. Thus, this remarkable research may lead to better instruction and greater funding for deserving students. BIBLIOGRAPHY Baker, D., Ed. (1984). Brain Research Update. Perspectives on Dyslexia, Aug., 1-4. Bear, M., Connors, B. and Paradiso, M. (1996). Neuroscience: Exploring the Brain. Baltimore, MD: Williams and Wilkins. Birch, H.G. and Belmont, L. (1964). Auditory-visual integration in normal and retarded Readers, American Journal of Orthopsychiatry, 34: 852-61. Blakeslee, S.S. (1991). Study Ties Dyslexia to Brain Flaw Affecting Vision and Other Senses, New York Times, 15 Sept. 1.1. Clark, D.B. and Uhry, J.K. (1995). Dyslexia: Theory & Practice of Remedial Instruction. Parkton, MD: York Press. Dykman, R.A. and Ackerman, P.T. (1991). Attention deficit disorder and specific reading disability, separate but often overlapping disorders. Journal of Learning Disabilities, 24:96-103. Galaburda, A.M. and Kemper, T.I. (1979). Cytoarchitectonic abnormalities in developmental dyslexia. A case study. Annals of Neurology, 6: 94-100. Galaburda, A.M., Ed. (1993). Dyslexia and Development: Neurobiological Aspects of Extra-Ordinary Brains, Cambridge, MA: Harvard University Press. Geschwind, N. (1982). Why Orton Was Right. Annals of Dyslexia. 32:13-30. Gilger, J. (2003). Genes and Dyslexia. Perspectives, 29 (2): 6-8. Gorman, C. (2003). The New Science of Dyslexia. Time Magazine. July 18, 52-58. Hinshelwood, J. (1917. Congenital Word Blindness. London: H.K. Lewis. Livingstone, M. and Hubel, D. (1988). Segregation of Form, Color, Movement and Depth: Anatomy, Physiology and Perception. Science 240:740-749. Lovegrove, W.J., and Williams, M. J. (1993). Visual temporal processing deficits in specific reading disability. Visual Processes in Reading and Reading Disabilities, D. M. Willows, R.S. Kruk and E. Corcos. (Eds.) Hillsdale, N.J.: Lawrence Erlbaum Associates. Money, J. and Schiffman, G. (Eds.) (1966). The Disabled Reader, Baltimore, MD: The Johns Hopkins University Press. Orton,
S.T. (1928). Specific reading disability Pollatsek, A. (1993). Eye movements in reading. Visual Processes in Reading and Reading Disabiities, D. M. Willows, R. S. Kruk, and H. Corcos. (Eds.). Hillsdale, N.J.: Lawrence Erlbaum Associates. Rosenzweig, M., Leiman, A. and Breedlove, S.M. (1999). Biological Psychology: An Introduction to Behavioral, Cognitive and Clinical Neuroscience, Sunderland, MA: Sinauer Associates, Inc. Shaywitz, S., et al. (2003). Neural Systems for Compensation and Persistence: Young Adult Outcome of Childhood Reading Disability, Journal of Biological Psychiatry, 54: 25-33.
|